INTRODUCTION TO TRADING ON TRADINGVIEW
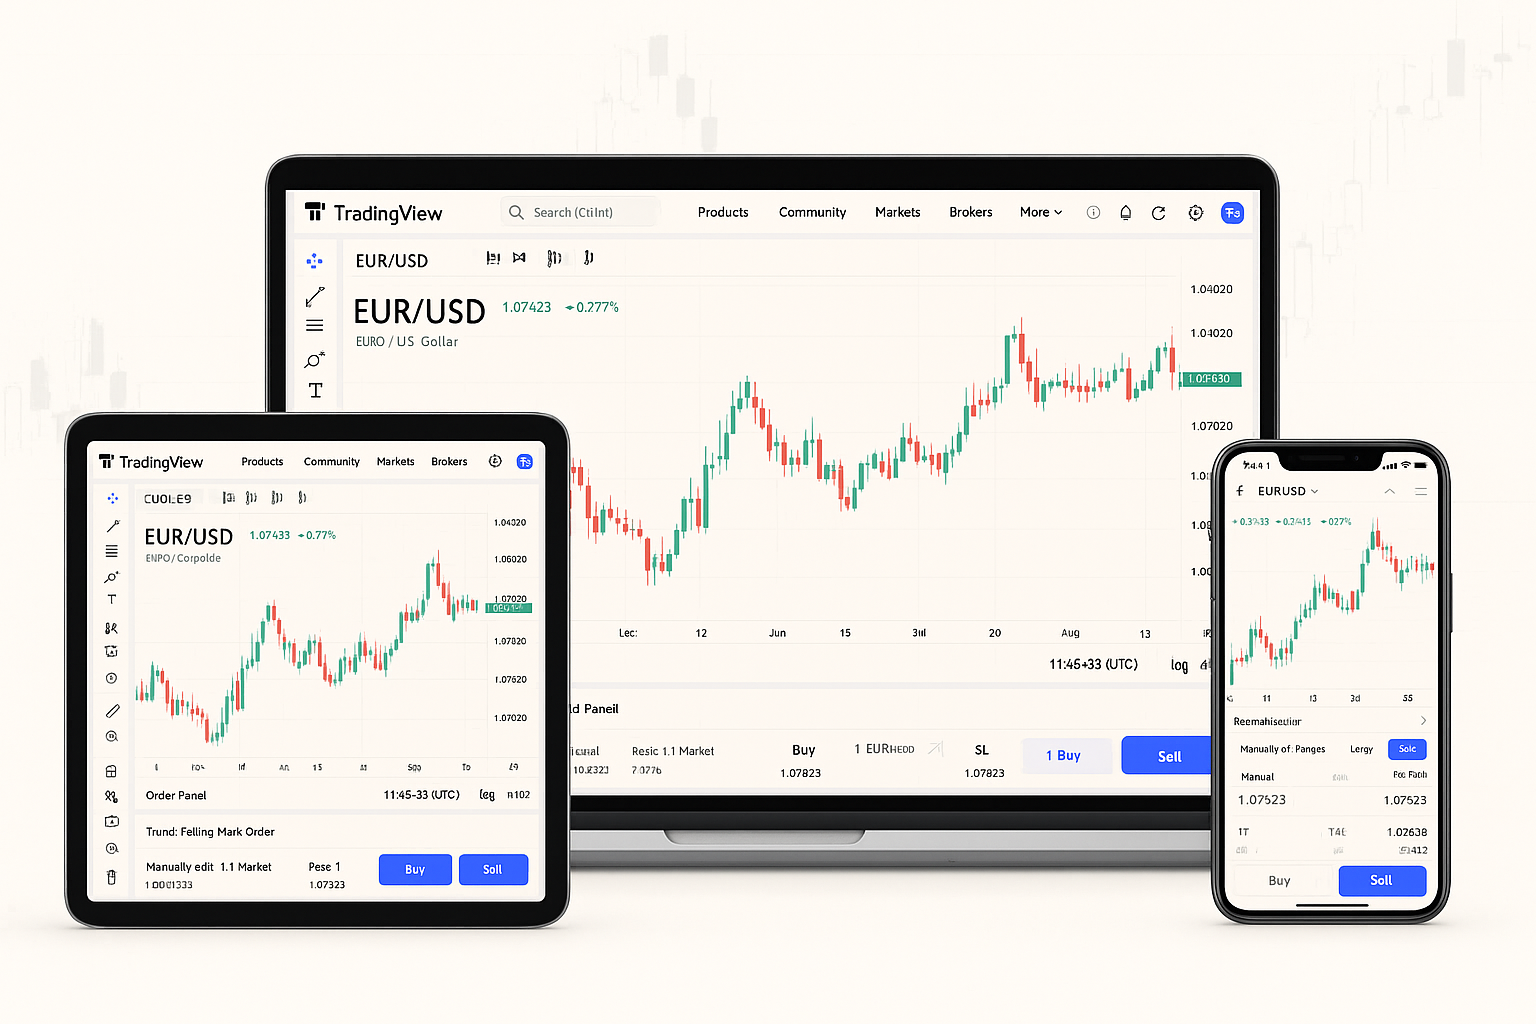
TradingView has transformed how retail and professional traders access charts, data feeds, and social insights—all in one browser-based hub. Its intuitive interface and vast community resources empower you to analyze markets, share ideas, and execute strategies efficiently.

What makes TradingView unique?
Unlike traditional charting suites, this platform combines real-time data across equities, forex, crypto, and futures with a social layer where analysts publish annotated charts and scripts. Customizable alerts, cloud-based layouts, and an open scripting language (Pine Script) set it apart from legacy terminals.
Supported markets and instruments
You can monitor and trade a broad spectrum of instruments:
- Equities: US, EU, and emerging-market stocks
- Forex: Majors, minors, and exotic cross-pairs
- Crypto: Top coins and emerging altcoins
- Commodities & Futures: Metals, energies, indices
- CFDs & OTC: Via integrated broker connections
GETTING STARTED WITH TRADINGVIEW
Before diving into charts, ensure your account is properly configured. A few initial steps will have you ready to research setups and place orders.
Creating your account and choosing a plan
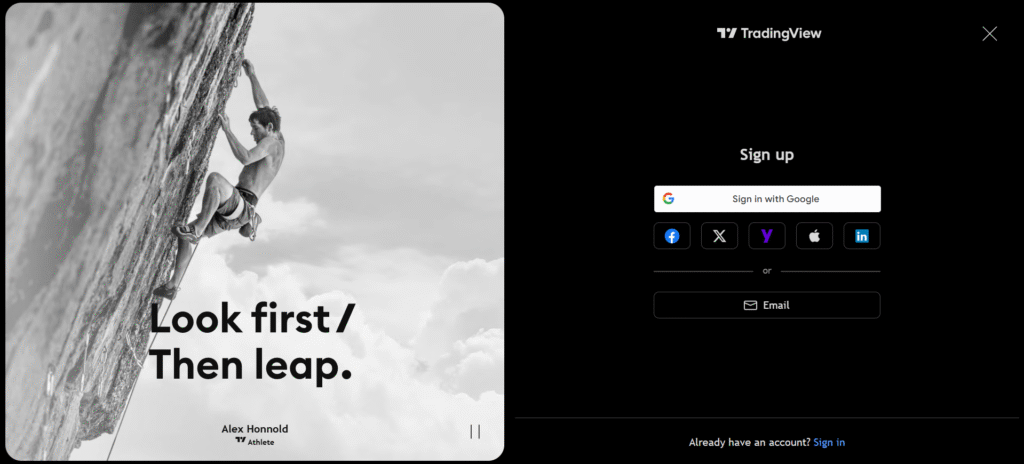
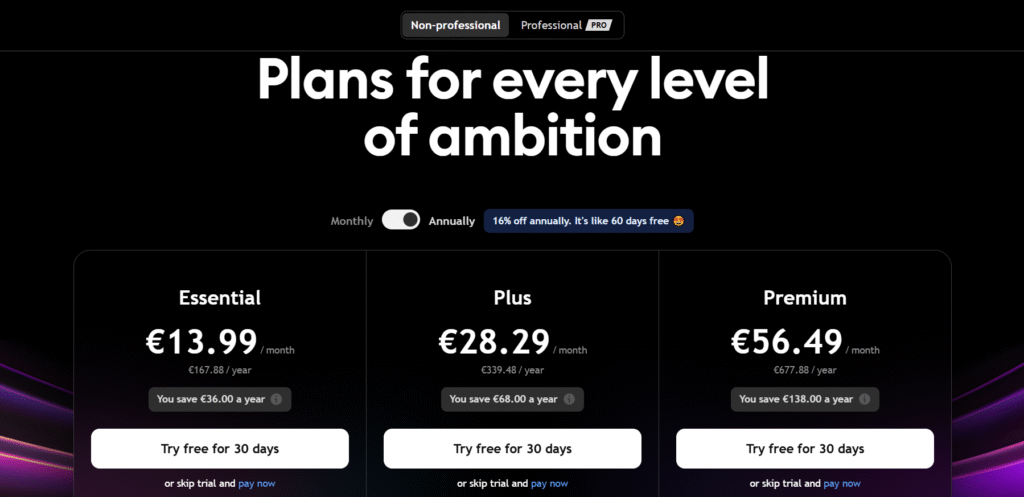
Sign up with your email or social login, then compare tiers (Free, Pro, Pro+ or Premium). Free access offers basic charts and alerts; paid plans unlock additional indicators per chart, more simultaneous alerts, and priority support.
Linking your broker and funding your wallet
Navigate to Trading Panel at the bottom of your chart, select your broker, and follow the OAuth or API-key authorization. Once connected, deposits and withdrawals happen through your broker’s portal, but you’ll place orders directly from the chart.
MASTERING CHARTS AND ANALYTICS
A sharp eye on price action begins with optimized visuals and overlays. Tailor your workspace to highlight patterns, momentum shifts, and trend reversals.
Selecting chart types and timeframes
| Chart Type | Use Case |
| Candlestick | Visualizing open/high/low/close |
| Heikin Ashi | Smoothing noise to spot trends |
| Renko | Filtering minor fluctuations |
| Line & Area | Quick overview of price trajectory |
Combine timeframes—from tick and 1-minute through monthly—to gauge both micro and macro dynamics.
Applying indicators and drawing tools
Select from 100+ built-in studies (e.g., RSI, MACD, VWAP) or import community scripts. Use trendlines, Fibonacci retracements, and pitchforks to map support and resistance. Group tools with custom palettes for faster access.
Building and saving custom layouts
Once you’ve arranged multiple charts, indicators, and watchlists, click Save Layout. Cloud storage ensures your configuration is available on any device—no need to rebuild when switching between desktop, tablet, or phone.
EXECUTING TRADES ON TRADINGVIEW
Seamlessly shift from analysis to execution without leaving the platform. Orders are placed directly on your charts, streamlining decision-making.
Placing market, limit & stop orders
Right-click on the price axis or use the order panel to select:
- Market Order – Immediate execution at current price
- Limit Order – Entry at a specified price or better
- Stop Order – Triggered when price crosses a threshold
Managing risk with stop-loss and take-profit
Define risk parameters by dragging the SL/TP handles on the order ticket. The platform calculates position size, risk-reward ratios, and P&L in real time.
Paper trading and live strategy testing
Before committing capital, switch to Paper Trading mode. Simulate order entries with live data to validate your edge, then transition to a funded account once confidence builds.
ADVANCED AUTOMATION & PINE SCRIPT
For systematic traders, automating analysis and alerts can unlock new efficiencies and reduce emotional bias.
Writing basic Pine Script indicators
Pine Script’s simple syntax lets you create custom oscillators or overlays in just a few lines. Start with the built-in editor, modify examples, and test in real time on any chart.
Backtesting and optimizing strategies
Use the Strategy Tester tab to replay historical data, measure performance metrics (e.g., CAGR, drawdown), and tweak parameters. Iterative backtesting helps identify robust setups.
Setting up alerts and auto-trade triggers
Create alerts on price levels, indicator crossovers, or custom conditions. For automated order execution, connect alert webhooks to third-party automation tools (e.g., AutoView, TradingConnector).
MOBILE & DESKTOP APPS FOR TRADINGVIEW
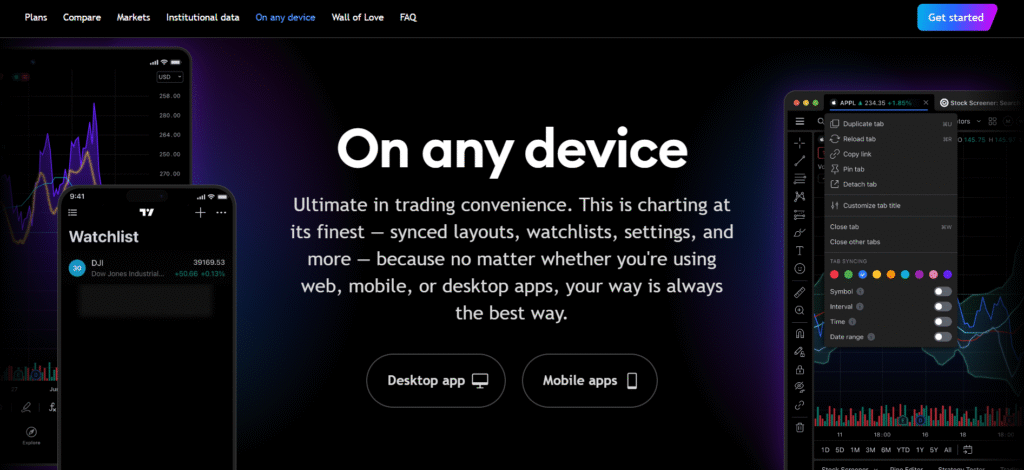
Whether at your desk or on the move, the platform adapts to your workflow, ensuring you never miss a key development.
Installing and syncing across devices
Download the native desktop client for Windows/Mac or install the mobile app from your store. Log in once to synchronize all layouts, watchlists, and alerts.
Quick-trade features in the mobile app
Tap-and-hold the price ladder to place orders, pinch to zoom charts, and swipe between symbols. The responsive design maintains full functionality even on smaller screens.
Using notifications and watchlists on the go
Receive push alerts for price triggers or indicator events. Organize dozens of instruments in thematic watchlists (e.g., “Tech Stocks”, “EUR Pairs”, “Crypto Movers”).
COMMUNITY INSIGHTS & RESEARCH TOOLS
Tapping into collective intelligence can surface fresh ideas and strategies you might otherwise miss.
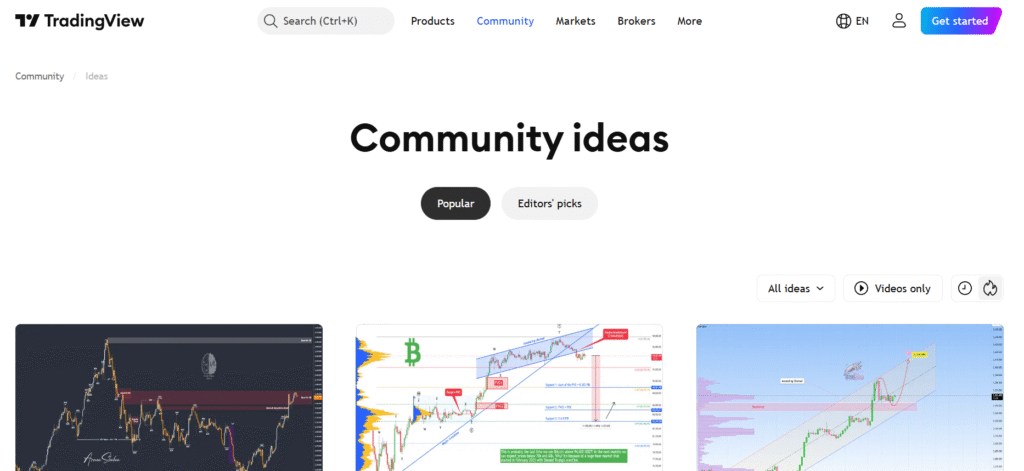
Browsing and publishing trade ideas
Explore the Ideas feed to view annotated charts from thousands of contributors. Publish your own analyses to build credibility and receive feedback.
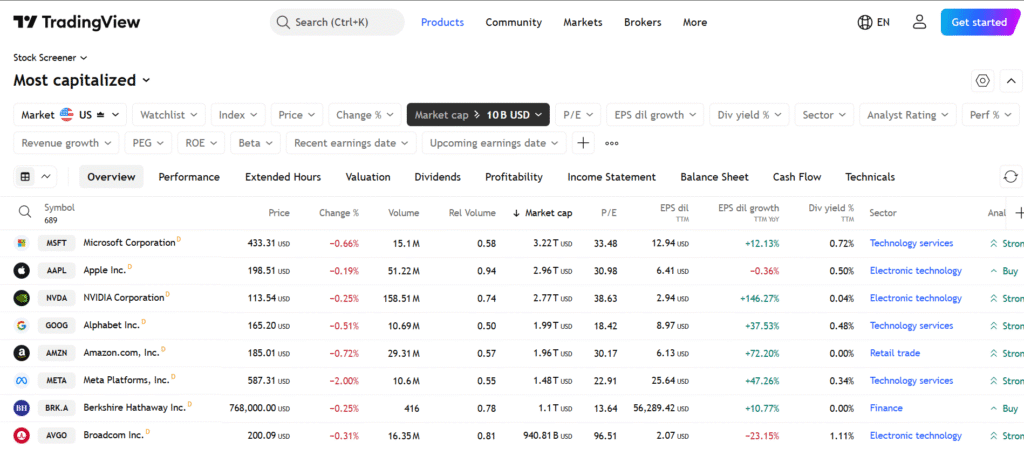
Using screeners, heatmaps, and scanners
Instantly filter thousands of symbols by fundamental or technical criteria. Heatmaps reveal sector rotations; scanners highlight unusual volume or volatility spikes.
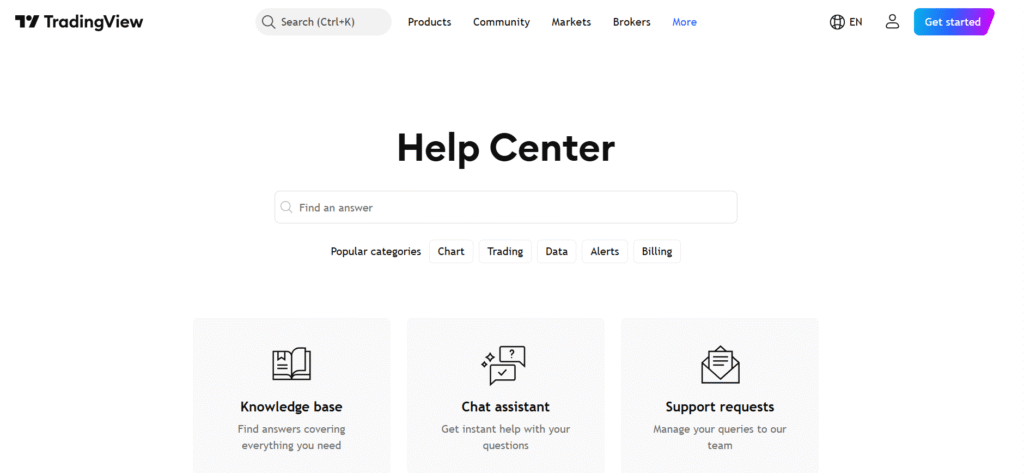
Accessing tutorials, webinars & support
Under Help Center, find step-by-step walkthroughs, video lessons, and live webinars hosted by experienced educators. Engage in community chats for real-time Q&A.
TIPS, SHORTCUTS & BEST PRACTICES
Fine-tune your experience with efficiency hacks that save time and reduce manual tasks.
Keyboard shortcuts and workflow hacks
- Alt + 1…8: Switch between chart layouts
- Ctrl + O: Open symbol search
- Spacebar: Toggle crosshair
- R: Reset chart zoom
Ensuring data accuracy and speed
Choose premium data feeds for real-time ticks. Close unused tabs and layouts to preserve CPU and bandwidth.
Comparing free vs. paid subscription tiers
| Feature | Free | Pro | Pro+ | Premium |
| Indicators per chart | 3 | 5 | 10 | 25 |
| Alerts (active) | 1 | 10 | 30 | 400 |
| Simultaneous layouts | 1 | 2 | 4 | 8 |
FREQUENTLY ASKED QUESTIONS
These answers address common concerns for both new and experienced users navigating TradingView’s features and trading capabilities.
Can I trade live with paper-trade charts?
No. While you can simulate trades using paper-trading mode, executing real trades requires linking your TradingView account with a supported broker. Paper trading is useful for strategy testing without risk.
Is TradingView good for beginners?
Yes. TradingView’s user-friendly interface, educational content, and visual tools make it ideal for new traders. Beginners can start with basic indicators, paper trading, and community ideas before progressing to more advanced features.
Which assets and exchanges are available?
TradingView supports thousands of instruments including stocks, forex pairs, cryptocurrencies, indices, and futures from global exchanges like NYSE, NASDAQ, CME, Binance, and more. Availability may vary by broker connection and plan.
How secure is my TradingView account?
TradingView uses strong encryption, 2FA (two-factor authentication), and secure cloud infrastructure. For extra safety, enable 2FA in your account settings and avoid sharing login credentials or API keys.
Does TradingView offer real-time data?
Yes, though real-time data depends on your plan and selected exchange. Free users often receive delayed data for stocks, while Pro or Premium plans can access real-time quotes or buy specific exchange feeds.
Can I use TradingView without a broker?
Absolutely. You can use all charting, analysis, and community features without linking a broker. However, trading execution requires broker integration.
What browsers and devices are supported?
TradingView works on most modern browsers (Chrome, Firefox, Edge, Safari) and is compatible with Windows, macOS, iOS, and Android devices via dedicated apps.
Is Pine Script hard to learn?
Not at all. Pine Script is designed to be lightweight and beginner-friendly. Many users start by modifying existing community scripts, then gradually write their own indicators and strategies.
Can I trade crypto on TradingView?
Yes. TradingView supports charting and trading for major cryptocurrencies via integrations with exchanges like Binance, Kraken, and Coinbase. You’ll need an account with the crypto exchange to place live trades.
What’s the difference between paper trading and strategy testing?
Paper trading lets you simulate real-time trades manually. Strategy testing, on the other hand, runs a scripted trading strategy against historical data to evaluate its performance.
Are TradingView alerts free?
Basic alerts are available on the free plan, but higher tiers offer more simultaneous alerts, advanced conditions, and webhook integration for automation.
Can I cancel my TradingView subscription anytime?
Yes. Subscriptions can be canceled at any time via the account settings. Your access remains active until the end of the current billing cycle.
CONCLUSION & NEXT STEPS
By mastering chart analysis, order execution, and community tools, you’ll harness the full potential of the platform. Start with simple paper trades, iterate your strategies in Pine Script, and gradually scale into live markets with confidence.
